B.A.M. Digital
WHY YOU SHOULD INVEST INVESTMENT PHILOSOPHY PORTFOLIOS Strategic Providers FAQ
ES EN

Diversification across regions and asset classes is key since there is no asset class that consistently outperforms over time.

Why Asset Allocation?

Throughout history, academia and industry both confirm that asset class selection is the outmost contributor to overall portfolio performance. The following graph highlights Calendar year returns by asset class. It clearly illustrates how the top performers from 2001 until 2021 varied throughout the decades.

2001 2002 2003 2004 2005 2006 2007 2008 2009 2010 2011 2012 2013 2014 2015 2016 2017 2018 2019 2020 2021 2022
Fixed
income
8.4%
Fixed
income
10.3%
Sm cap

47.3%
Int'l

20.3%
Int'l

13.5%
Int'l

26.3%
Lg cap
growth
11.8%
Fixed
income
5.2%
Lg cap
growth
37.2%
Sm cap

26.9%
Fixed
income
7.8%
Lg cap
value
17.5%
Sm cap

38.8%
Lg cap
core
137%
Lg cap
growth
5.7%
Sm cap

21.3%
Lg cap
growth
30.2%
Cash

1.9%
Lg cap
growth
36.4%
Lg cap
growth
38.5%
Lg cap
core
28.7%
Cash

1.5%
Cash

4.4%
Cash

1.8%
Int'l

38.6%
Sm cap

18.3%
Lg cap
value
7.1%
Lg cap
value
22.3%
Int'l

11.2%
Cash

2.1%
Int'l

31.8%
Lg cap
growth
16.7%
Lg cap
growth
2.6%
Int'l

17.3%
Lg cap
growth
33.5%
Lg cap
value
13.5%
Lg cap
core
1.4%
Lg cap
value
17.3%
Int'l

25.0%
Fixed
income
0.0%
Lg cap
core
31.5%
Sm cap

20.0%
Lg cap
growth
27.6%
Lg cap
value
-7.5%
Sm cap

2.5%
Div
portfolio
-9.8%
Lg cap
value
30.0%
Lg cap
value
16.5%
Div
portfolio
5.4%
Sm cap

18.4%
Fixed
income
7.0%
Div
portfolio
-22.8%
Sm cap

27.2%
Lg cap
value
15.5%
Lg cap
core
2.1%
Sm cap

16.4%
Lg cap
value
32.5%
Lg cap
growth
13.1%
Fixed
income
0.6%
Lg cap
core
12.0%
Lg cap
core
21.8%
Lg cap
growth
-1.5%
Lg cap
value
26.5%
Lg cap
core
18.4%
Lg cap
value
25.2%
Fixed
income
-13.0%
Div
portfolio
-4.8%
Lg cap
value
-15.5%
Lg cap
growth
29.8%
Lg cap
core
10.9%
Lg cap
growth
5.3%
Lg cap
core
15.8%
Div
portfolio
6.0%
Sm cap

-33.8%
Lg cap
core
26.5%
Lg cap
core
15.1%
Div
portfolio
1.8%
Lg cap
core
16.0%
Lg cap
core
32.4%
Div
portfolio
8.1%
Div
portfolio
0.1%
Div
portfolio
8.7%
Div
portfolio
15.1%
Lg cap
core
-4.4%
Sm cap

25.5%
Div
portfolio
14.7%
Sm cap

14.8%
Int'l

-14.5%
Lg cap
value
-5.6%
Int'l

-15.9%
Lg cap
core
28.7%
Div
portfolio
10.5%
Lg cap
core
4.9%
Div
portfolio
13.0%
Lg cap
core
5.5%
Lg cap
core
-36.9%
Div
portfolio
20.8%
Div
portfolio
13.0%
Lg cap
value
0.4%
Lg cap
growth
15.3%
Int'l

22.8%
Fixed
income
6.0%
Cash

0.1%
Lg cap
growth
7.1%
Sm cap

14.7%
Div
portfolio
-4.7%
Int'l

22.0%
Int'l

7.8%
Div
portfolio
13.9%
Div
portfolio
-16.3%
Lg cap
core
-11.9%
Sm cap

-20.5%
Div
portfolio
23.5%
Lg cap
growth
6.3%
Sm cap

4.6%
Lg cap
growth
9.1%
Cash

5.0%
Lg cap
core
-37.0%
Lg cap
value
19.7%
Int'l

7.8%
Cash

0.1%
Div
portfolio
12.2%
Div
portfolio
20.3%
Sm cap

4.9%
Int'l

-0.8%
Fixed
income
2.7%
Lg cap
value
13.7%
Lg cap
value
-8.3%
Div
portfolio
22.0%
Fixed
income
7.5%
Int'l

11.3%
Lg cap
core

-18.1%
Lg cap
growth
-20.4%
Lg cap
core
-22.1%
Fixed
income
4.1%
Fixed
income
4.3%
Cash

3.1%
Cash

4.9%
Lg cap
value
-0.2%
Lg cap
growth
-38.4%
Fixed
income
5.9%
Fixed
income
6.5%
Sm cap

-4.2%
Fixed
income
4.2%
Cash

0.1%
Cash

0.0%
Lg cap
value
-3.8%
Int'l

1.0%
Fixed
income
3.5%
Sm cap

-11.0%
Fixed
income
8.7%
Lg cap
value
2.8%
Cash

0.1%
Sm cap

-20.4%
Int'l

-21.4%
Lg cap
growth
-27.9%
Cash

1.2%
Cash

1.3%
Fixed
income
2.4%
Fixed
income
4.3%
Sm cap

-1.6%
Int'l

-43.4%
Cash

0.2%
Cash

0.1%
Int'l

-12.1%
Cash

0.1%
Fixed
income
-2.0%
Int'l

-4.9%
Sm cap

-4.4%
Cash

0.3%
Cash

0.9%
Int'l

-13.8%
Cash

2.3%
Cash

0.7%
Fixed
income
-1.5%
Lg cap
growth

-29.1%

Scroll to see previous and nexts years.

Key determinants of portfolio performance

In the previous years, sophisticated investing solutions were limited to the institutional level; now these are broadly available.

Globally, investors are moving away from products that offer limited investment opportunities and towards a model, or a “whole portfolio” approach.

Today, any person that wishes to invest has access to a diversified Model Portfolio Solution through our digital platform.

Our Model Portfolios

We manage your portfolios using models designed by BlackRock, one of the world’s largest asset management firm**. The purpose of these model portfolios is to deliver efficiency, transparency, and cost effectiveness. The selected UCITS ETFs that are part of the Model Portfolios are designed to meet specific goals such as global diversification, tactical exposures, and tax efficiency. The implementation procedure guides each individual investor on how to invest in the most appropriate vehicle for their profile. The vehicle selection process is primarily driven by exposure, efficiency, and cost; leveraging more than 300 UCITS ETFs.

**At our discretion, we may elect to deviate from any models provided by BlackRock.

BlackRock®'s portfolio construction process

Variables

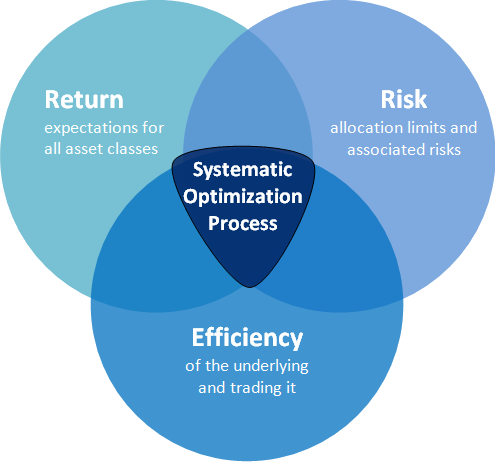
The variables in the systematic optimization process are Return-Risk-Efficiency.

Process

The Model Portfolio Solutions (MPS) Construction is a simple four-step process that leverages the entirety of BlackRock®’s technology and risk platform.
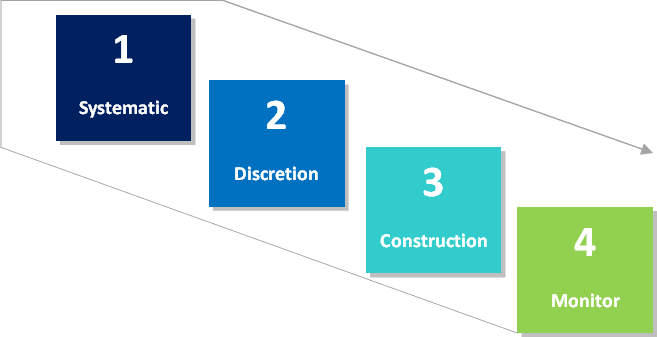
1. SYSTEMATIC – by translating investor outcomes into well-diversified allocations through a proprietary optimization process.
2. DISCRETION – when evaluating risks and opportunities associated with attractively priced asset classes.
3. CONSTRUCTION – through identifying cost-effective and efficient holdings and selecting them for constructing the portfolio.
4. MONITOR – a team of professionals are constantly monitoring the portfolio to quickly adapt to changing market conditions.

How We Invest?

Methodology

Risk Capacity

When you open your account, we ask you a few questions so we can determine your attitude towards risk and risk tolerance, investment knowledge and objectives, your net worth, time horizon and liquidity needs.

Investment Vehicles

In order to create globally diversified portfolios, the Model Portfolios use across-the-board uncorrelated asset-classes. In order to accomplish this, it only uses UCITS ETFs. Regularly, the universe of UCITS ETFs in the Model Portfolios is reviewed to identify the most appropriate ones to represent each of the asset classes. The Model Portfolios include the UCITS and ETFs that offer market liquidity, minimize tracking error and are tax efficient.

Asset Allocation

Through systematic investment processes and an in-depth analysis on each asset class, the use of models aims to maximize the risk-adjusted expected return. The objective is to create an asset allocation that produces the maximum possible return while respecting your particular risk tolerance. Translating investor outcomes and restrictions into globally well-diversified allocations: Return – Risk – Cost.

Monitoring and Rebalancing

To keep portfolios in track with long-term goals, the Model Portfolios are monitored and regularly rebalanced back to its target mix in an effort to optimize returns for their intended level of risk.

Why Only UCITS ETF's?

A UCITS ETFs is a security that usually tracks a basket of stocks, bonds, or assets like an index fund, but trades like a stock on a stock exchange. They closely track their benchmarks, such as Dow Jones Industrial Average or the S&P500. They provide great diversification, offer ample liquidity, and are tax efficient for investors who do not reside in the U.S.

Definite Mandates

We only use UCITS ETFs that have a definite mandate to passively track benchmark indexes. This restricts the fund manager to simply replicate the performance of the benchmark they follow and ensures the same level of investment diversification as the benchmark itself.